Discount code statistics, measure the impact of your discount codes
See how many orders use discount codes, what the discount costs you and whether the codes are driving additional sales or just giving away margin. Use Shoporama's discount code statistics to assess whether your campaigns are actually making money.
What do the discount code statistics show?
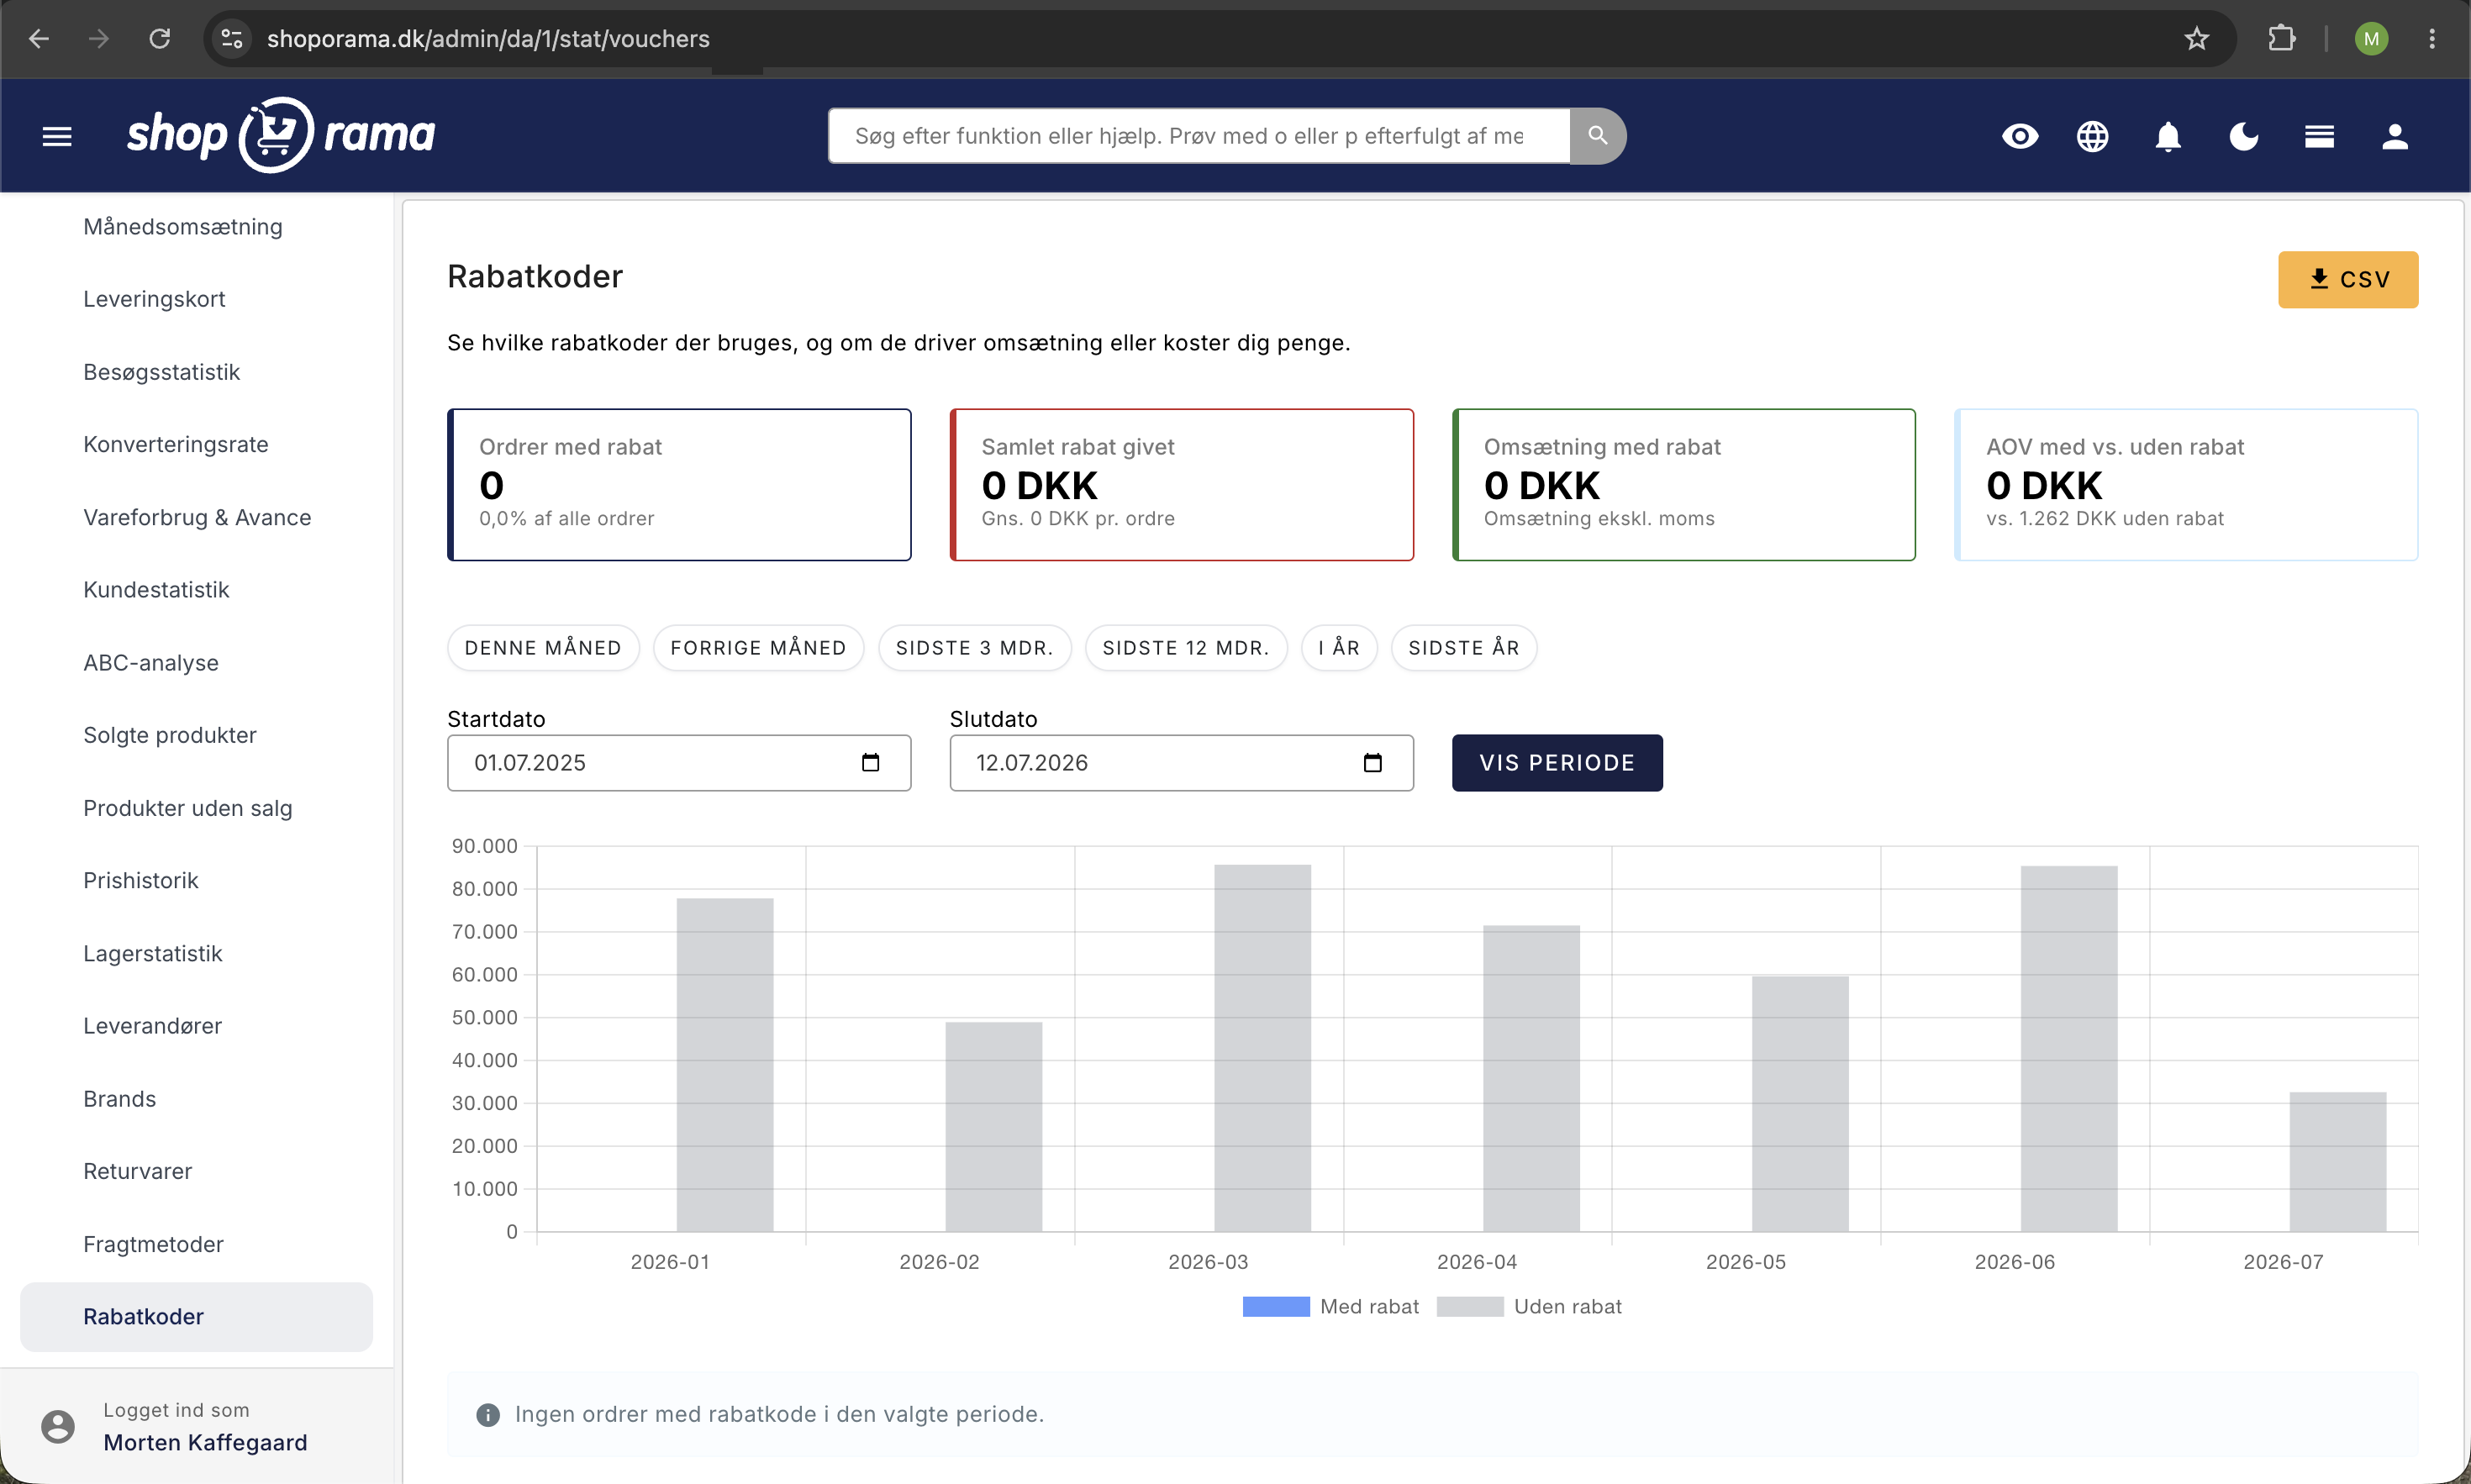
Under Statistics → Discount Codes, you’ll find a comprehensive analysis of how your discount codes are performing. This page helps you answer questions such as: What percentage of my orders use a discount code? How much do the discounts cost me in lost revenue? And do my codes help raise or lower the average order value?
The four key metrics at the top
At the top of the page, you’ll see four cards with the most important key metrics for the selected period:
- Discounted orders: the number and percentage of orders where a discount code was used. By tracking this figure over time, you can see whether discount usage is increasing or decreasing.
- Total discounts given: the total amount your customers have saved via discount codes, as well as the average discount per order. This is your direct cost of offering discounts.
- Revenue from Discounts: The total revenue from orders with discount codes, compared to the previous period. Compare this to total revenue to see how much discount code orders contribute.
- AOV with vs. without discount: The difference in average order value (AOV) between orders with and without a discount code. A positive number means that customers using discount codes spend more on average.
Bar chart: With and without discount
The graph shows revenue broken down by orders with and without discount codes, categorized by day or month. This gives you a visual overview of when discount codes are used most frequently—for example, during campaigns, Black Friday, or seasonal sales. Below the graph, you’ll see a table with the exact figures for each period, so you can track trends over time.
Table by discount code
Further down, you’ll find a detailed table listing each individual discount code. For each code, you’ll see:
- Code: the discount code with a badge indicating whether it’s a percentage discount or a fixed amount
- Used: the number of times the code has been used
- Total discount: the total discount amount for the code
- Revenue: the revenue generated by orders using the code
- Avg. Order Value: the average order value when this code is used
- Status: whether the code is still active or has expired
- Last used: When the code was last used
The table is sorted with the most frequently used codes at the top, so you can quickly see which codes are used most often. You can click on a code to edit it.
Select a time period
Use the quick-select options at the top to change the time period: this month, last month, last 3 months, last 12 months, this year, or last year. You can also select a custom time period with a start and end date.
CSV export
Click “Export CSV” to download all data for further analysis in Excel or Google Sheets. The export includes all columns from the table and is useful for accounting or for sharing with your accountant.
Tips for Using Discount Code Statistics
- Compare the AOV(Average Order Value). If the order value is higher with a discount code, the codes are driving additional sales. If it’s lower, you may simply be offering discounts on purchases that would have happened anyway. Consider setting a minimum purchase requirement as a condition in the discount code setup.
- Keep an eye on the discount rate over time; a rising discount rate may mean that customers are getting used to waiting for discounts. This can erode your profit margin.
- Identify popular codes; codes with a high number of redemptions but low revenue may indicate that the code is being shared outside your target audience.
- Check to see if old codes are still circulating; look for codes that are being used but that you thought had expired. Some customers share codes on coupon sites. Consider setting expiration dates and usage limits.
- Measure campaign effectiveness; create unique codes for each campaign so you can see exactly which campaign performs best. Combine this with conversion rate statistics to get the full picture.
Discount codes are a powerful sales tool, but only if you monitor their effectiveness. Use the statistics to ensure that your discounts are actually driving revenue and not just eating into your profit margin.
Need help? Contact us at support@shoporama.dk.
Related articles
Create a discount code
Complete guide to creating and managing discount codes in Shoporama - percentage discount, fixed amount, free shipping, restrictions and more.
Statistics and analytics in Shoporama
Get an overview of Shoporama's built-in statistics tools: dashboard, revenue, profit margin, ABC analysis and much more. Learn how to use data to...
Discount codes on a group of products
Guide to creating discount codes that only apply to a limited group of products in Shoporama.
Campaigns
Learn how to create promotions in Shoporama that automatically give your customers a discount. Choose from five promotion types: fixed price,...
Related features
Discount codes - unlimited discount codes for your online store
Create unlimited discount codes with percentage off, fixed amount or free shipping. Limit per date, quantity and product group. Included in Shoporama.
Statistics and analytics
Dashboard, revenue, profit margin, ABC analysis and more. Shoporama's built-in statistics tools give you insights to run your online store profitably.