Statistics by Supplier: Who Are You Making Money From?
See what percentage of your revenue each supplier accounts for, what’s included in the figures, and how to calculate the contribution margin per supplier.
Most online store owners know their total revenue by heart. Far fewer can say what percentage of that comes from each individual supplier. And that’s exactly the figure you need when negotiating purchase prices, renewing contracts, or assessing how vulnerable your store is if a single supplier raises prices or goes out of business.
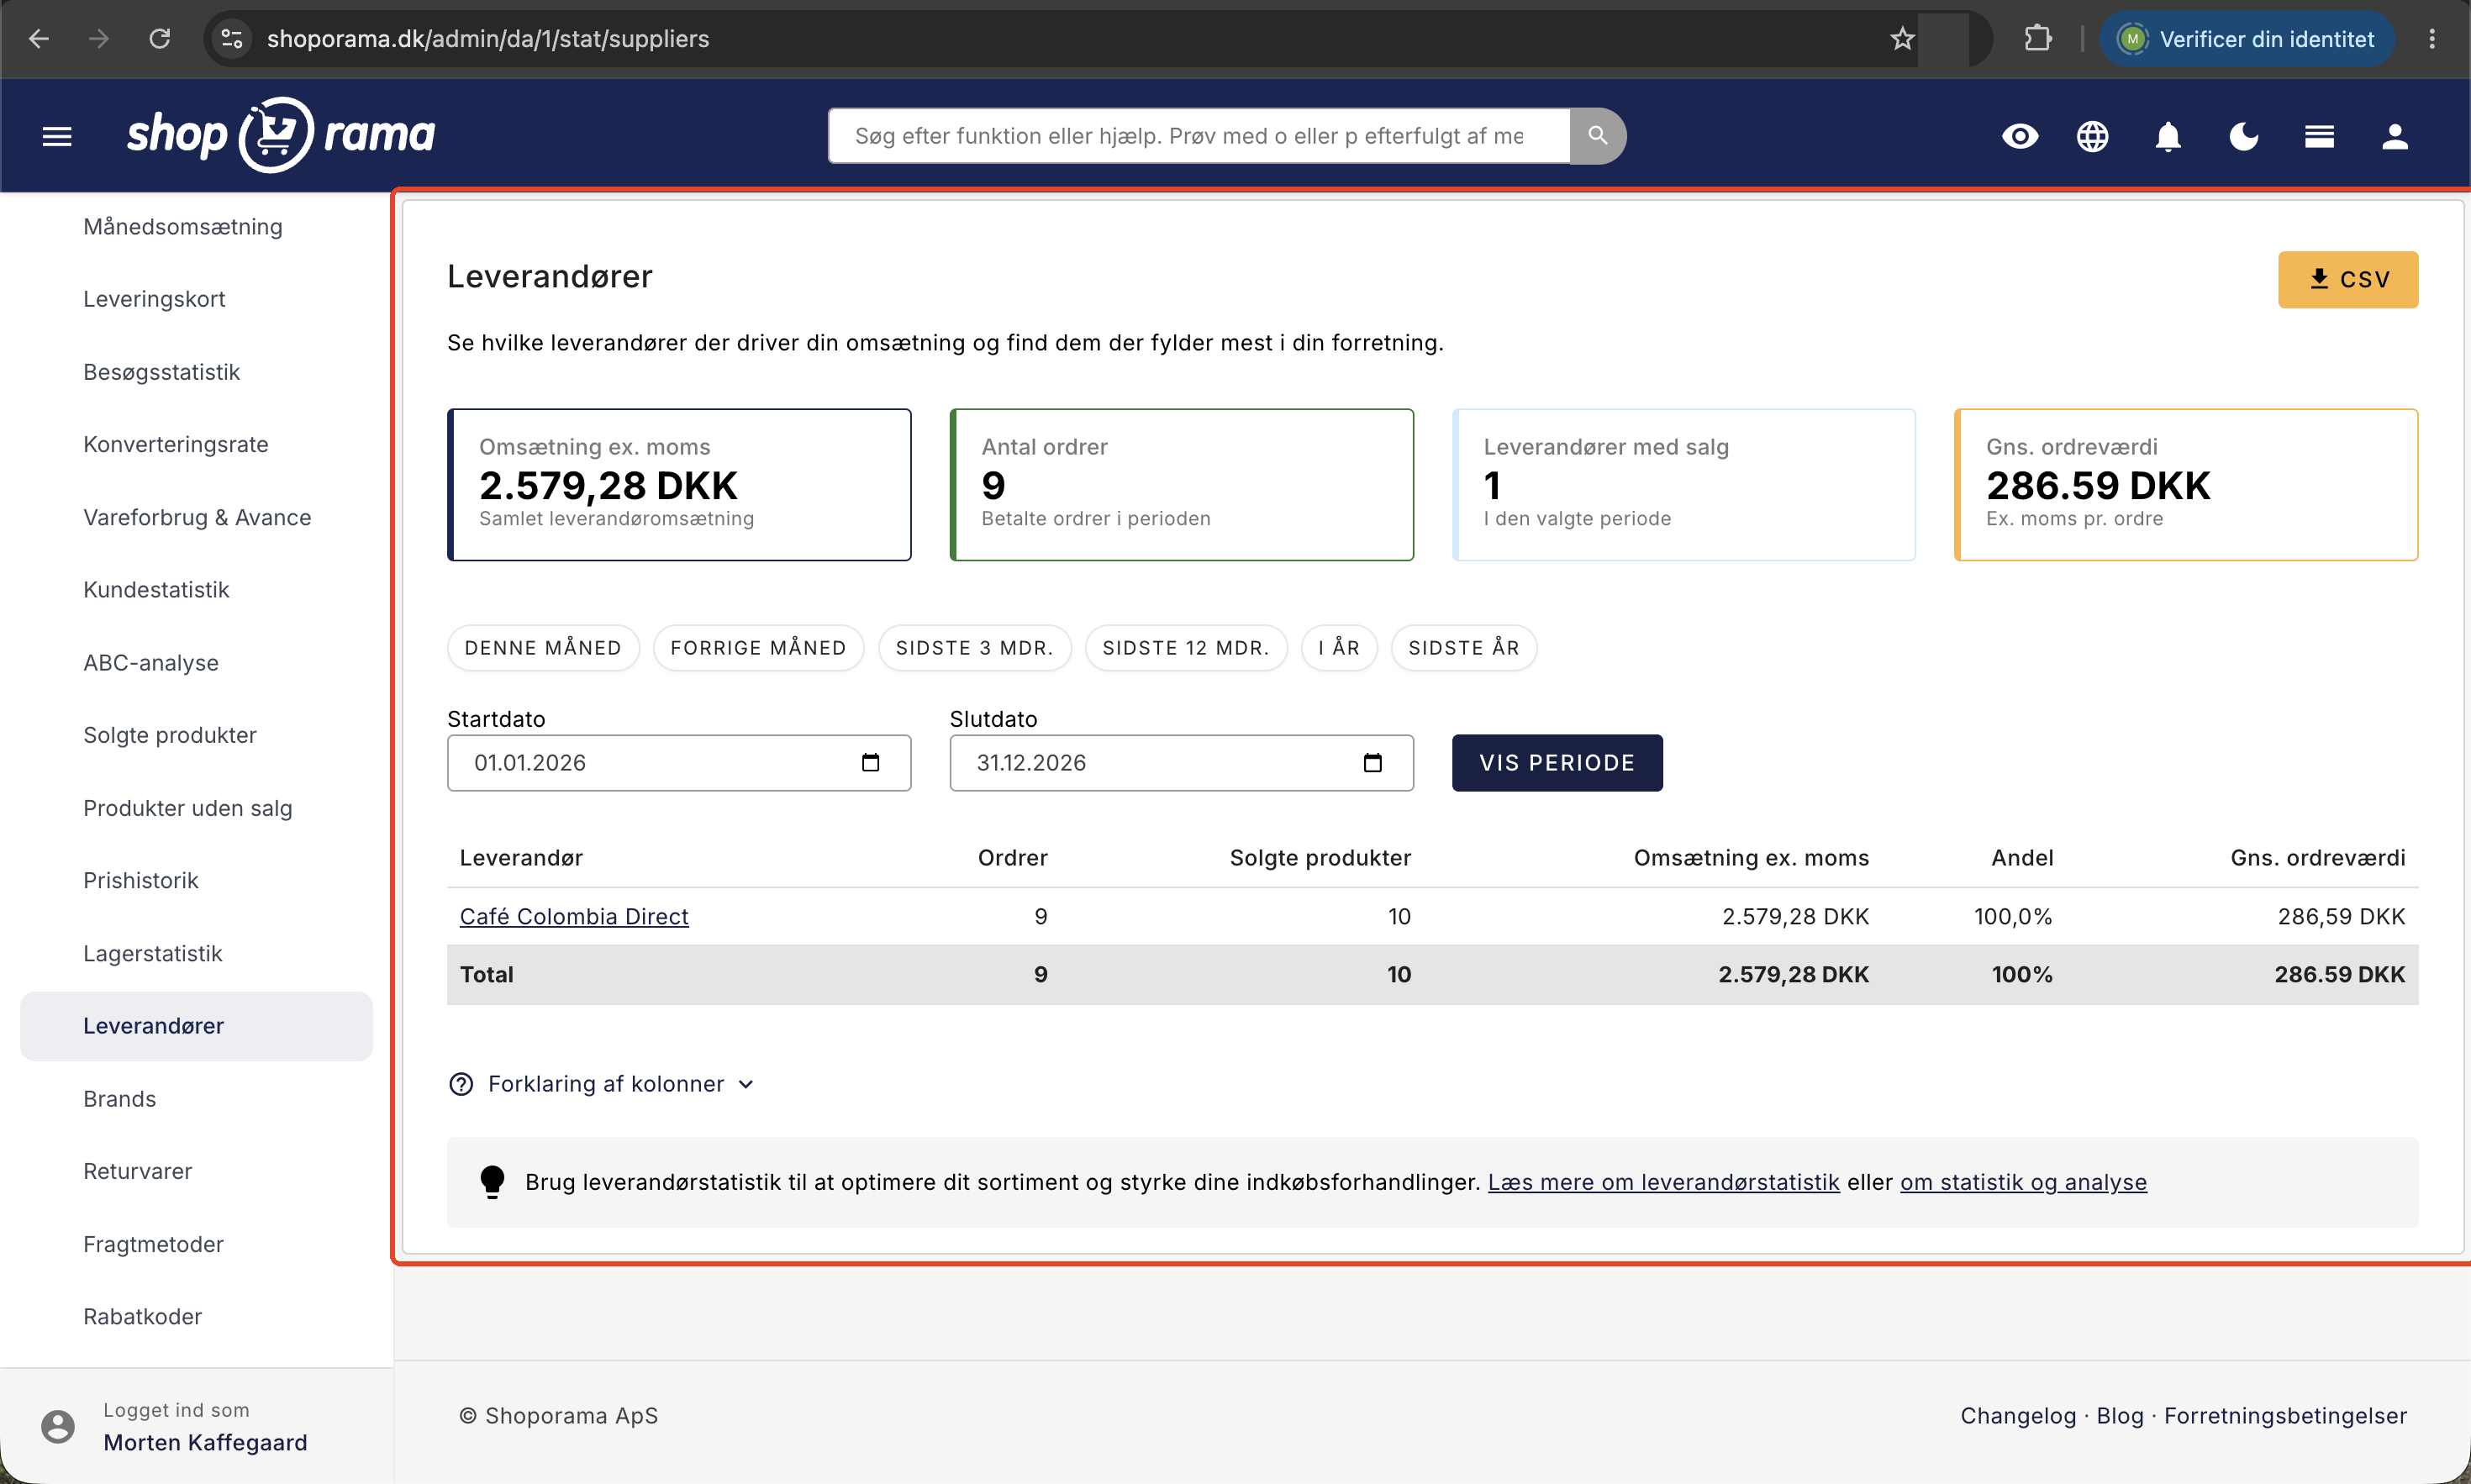
The “Suppliers” page under “Statistics” compiles this information for you. For any selected time period, it shows how many orders and units each supplier has accounted for, what that amounts to in revenue (excluding tax), and what percentage of total revenue the supplier represents.
How to find the page
Go to Statistics and select Suppliers from the menu on the left. There are two menu items with that name: under “Products,” you can create and edit the suppliers themselves, and under “Statistics,” you can view the sales figures. If you haven’t created any suppliers yet, start with the Shoporama supplier setup guide.
Only products with a supplier are included
The statistics are based exclusively on products where the “Supplier” field is filled in the product’s master data. If you have 100 products but have only assigned a supplier to 15 of them, the page will only show sales for those 15. The rest won’t appear at all—not even as a “remainder” or a line labeled “unknown.”
This is by far the most common reason why the numbers look suspiciously low, or why the message “No suppliers with sales in the selected period” appears, even though the store is running smoothly. You can set the supplier on the product page under Products, All Products. If it’s missing from many items, you can fix this all at once using bulk editing or product import.
The four key metrics at the top
- Revenue excl. tax (Total supplier revenue). All line items from products with a supplier, excluding tax and in the store’s currency.
- Number of orders (Paid orders during the period). The number of distinct orders containing at least one item from a supplier. Each order counts only once, regardless of how many suppliers it includes items from.
- Suppliers with sales (in the selected period). Suppliers with no sales are not displayed.
- Average order value (excl. VAT per order). Revenue divided by the number of orders shown in the card next to it.
Please note: Number of orders—in the table, orders are counted per supplier, but in the card view and in the total row, each order is counted only once. An order containing items from three suppliers therefore appears in all three rows but counts as a single order in the total. If you add the rows together, you may get a higher number than the total, and that’s exactly as it should be. Orders that contain only items without a supplier are not counted at all. If you need the store’s actual number of orders, you’ll find it in the order overview. The average order value is also not the store’s actual average order, because it’s based only on product lines with a supplier and doesn’t include shipping.
The table, column by column
The table is sorted by revenue, so the largest supplier is at the top. If you click on “Column Explanation” at the bottom of the page, Shoporama’s own explanation expands:
- Supplier. The name, which is also a link. More on this in the section on contribution margin.
- Orders. The number of paid orders containing products from this supplier.
- Products Sold. Total number of units sold—that is, pieces, not kroner.
- Revenue excl. tax. Revenue excluding tax for the supplier’s products. This is the figure you can compare to your purchase prices.
- Share. The supplier’s share of total supplier revenue. A high concentration on a single supplier can be a risk.
- Average order value. Average revenue excluding VAT per order for this specific supplier.
At the bottom is a “Total” row, where each order is counted once, just as in the charts at the top. The average order value in the total row is the total supplier revenue divided by that number. If more than one supplier has made sales, a horizontal bar chart is also displayed showing the ten largest suppliers by revenue. If a supplier has been deleted, the name is crossed out and no longer linked, so the history is preserved even if you clean up the supplier list.
The period you’re viewing
When you open the page, the current calendar year is displayed—that is, January 1 through December 31 of this year. The shortcut buttons cover the most commonly used periods: This Month, Last Month, Last 3 Months, Last 12 Months, This Year, and Last Year.
The shortcuts do not correspond to exact calendar months. They count back a certain number of days and then round up to whole months, so the period is usually broader than the name suggests:
- “This Month” runs from the 1st of the month through today, not to the last day of the month.
- “Last Month” is based on the date 30 days ago. If you’re viewing this on the 31st of a month, the button will therefore land on the month you’re already in.
- "Last 3 months" starts on the 1st of the month that was 90 days ago and ends on the last day of the current month. This typically spans four calendar months.
- "Last 12 months" works the same way with 365 days and typically covers thirteen calendar months.
- "This Year " and "Last Year " are the only ones that are exact, covering January 1 through December 31.
Therefore, always check the Start Date and End Date afterward so you know what the numbers cover. If you need to compare two periods precisely, enter the dates yourself and click “Show Period.” The end date is used exactly as you select it. Only a date that doesn’t exist—such as February 31—is moved to the last day of the month. Both dates are included, and the period is based on the order date—that is, when the order was placed—not when you shipped it or received payment.
Which orders are included?
The figures are based on paid orders with the status New, In Progress, Pending, Ready, Ready for Pickup, Picked Up, or Shipped, and only on the actual line items calculated without tax. The following are not included:
- Unpaid orders, canceled orders, and orders with the status “Credit Memo.” If you delete an order, it is also removed from the figures.
- Credit memos and return orders. The figures represent gross sales, with returns not deducted. You can view returned items instead under Statistics, Returned Items.
- Shipping, fees, and deposits that do not belong to a supplier.
- Discounts from a discount code applied to the entire order. The item lines show the price the customer paid for the item, including any promotional price, but an order discount is not deducted.
If you sell bundle packages, both the package and the items included in it are counted as sold units. The price is listed for the bundle itself, while the individual items are listed at 0 DKK. If they belong to another supplier, that supplier may therefore appear with units and orders, but without revenue.
What about the contribution margin?
The supplier page shows revenue, not contribution margin. It knows your selling price but does not subtract the cost price. If you want to know what you’re actually earning from a supplier, you’re just one click away: click on the supplier’s name in the table. This opens the “Products Sold” report with that specific supplier and the same time period already selected, and here you’ll see a key figure for “Contribution Margin ” plus the “CM / Margin” column per product—that is, revenue excluding VAT minus cost price.
And here’s the crucial requirement: contribution margin can only be calculated for products for which you’ve entered a cost price. If the cost price is missing, the product’s contribution margin is displayed as “-”, and the product isn’t included in the total at all. That’s why it also says “Only products with a cost price” below the figure. If you have a cost price for only half of the items, your contribution margin will appear artificially low, even though the revenue is correct. This isn’t an error in the figure, but a gap in your master data.
Cost prices are always entered excluding VAT and are never shown to your customers. You enter them in three places:
- For each individual product in the “Cost Price Excl. VAT” field.
- Per variant in the variant overview, in the “Cost” column. If the variant has its own cost, that is used instead of the product’s.
- Collectively under Inventory, Cost Prices, where the Missing Cost Price tab shows exactly which items are missing. The Save Cost Prices button updates the profit margin statistics immediately.
For a complete overview of cost prices and inventory value, read “Cost Prices and Inventory Value.”
Download the data as a CSV
The CSV button in the upper right downloads the table as a file for Excel, Numbers, or Google Sheets. The file contains data for the exact period you’ve selected, the same six columns, and a total row at the bottom. The total row is calculated dynamically, so orders are counted only once, and the average order value is calculated based on that figure. The file is semicolon-separated and formatted so that Danish characters and numbers are displayed correctly, while the column headers are in English. If you need figures at the product level, you can export sales data from the product overview.
How to Interpret the Numbers
- Look for concentration risk. If a single supplier accounts for a very large portion of your revenue, you’re vulnerable to price increases and delivery failures. This may well be a conscious choice, but it should be a choice.
- Go into negotiations with the numbers in hand. Select “Last 12 Months” and download the CSV file. “We’ve sold 1,240 units and generated X DKK in revenue (excl. tax) from your products” carries more weight than a vague impression, and the number of units is often the strongest argument for a better purchase price or free shipping.
- Compare two years. Select “This Year” and then “Last Year,” and note the revenue and share for your top ten products. If a supplier’s performance has declined for two consecutive years, you should take a closer look before restocking the shelves.
- Identify the products that take up more space in your inventory than they generate in sales. Many products but low sales mean you’re paying for shelf space and tied-up inventory without getting enough return. Combine this with the “Products with No Sales” report.
- Check the profit margin before making any decisions. A supplier with lower sales but a significantly better contribution margin may be the best one to focus on. You can do the same analysis for brands and labels.
Frequently Asked Questions
Why is the revenue here lower than in my monthly revenue?
Because the two pages measure different things. The supplier page only counts line items from products with a specific supplier, excluding VAT, shipping, and fees, and without deductions for returns. Monthly revenue counts the entire order. If the difference is very large, it typically means that a supplier is missing for a large portion of the product range.
Can I use these figures directly in my accounting records?
No, this is a sales overview and not an accounting document. The figures do not include shipping, fees, returns, credit memos, or discount codes at the order level. To reconcile the figures, you’ll need to use your accounting software and your order summary.
Does the page show what I’ve purchased from the supplier?
No. It shows what you’ve sold from the supplier’s products in your store, not what you’ve purchased from them. You can find the value of your current inventory under Inventory Statistics and on the Cost Prices page, where the inventory value is based on the cost price of the items.
Why doesn’t “Number of Orders” match my order list?
Because the total only counts paid orders with at least one item from a supplier. An order that contains only items without a supplier isn’t counted at all, and neither are unpaid or canceled orders. Use the order overview when you need the actual number of orders.
Why do the rows under “Orders” add up to more than the total?
Because an order with items from multiple suppliers appears in each supplier’s row but counts only once toward the total. An order with items from three suppliers therefore contributes 1 to each of the three rows and 1 to the total. Both the rows and the total are correct; they simply answer two different questions.
The number of orders has decreased, and the average order value has increased. What happened?
Previously, the total was calculated as the sum of the rows, so an order containing items from three suppliers was counted three times. Now, each order is counted only once in the cards, in the total row, and in the total row of the CSV file. That’s why the “Number of Orders” is lower than before, and the “Average Order Value” is higher, because the same revenue is spread across fewer orders. The numbers in the individual rows are unchanged, and the revenue is the same.
What exactly does the “Share” column mean?
It shows what percentage of the period’s total supplier revenue each individual supplier accounts for. If only one supplier has made sales, it shows 100 percent, even if the store has also sold other items. The percentage is therefore calculated solely based on the data contained in the table itself.
I’m adding a supplier for the first time now. Will the old orders be included?
Yes. The statistics use the supplier currently listed for the product and recalculate the history from the beginning every time you open the page. So if you set the supplier today, last year’s sales will also appear. Conversely, the product’s entire history will transfer if you later switch the product to a different supplier.
I have variants, each with its own purchase price. Which cost price is used?
When you click through to the contribution margin, the variant’s own cost price is used if it’s entered for the sold variant. If it isn’t, the calculation falls back on the product’s standard cost price. If neither is entered, the contribution margin is displayed as “-”.
Can my customers see any of this?
No. The statistics are only available in the admin panel, and cost prices are never displayed in the online store. If you want a page in the store where customers can view products from a specific supplier, you should instead use the “Link to” field on the supplier’s page.
Can Claude retrieve the numbers for me?
Yes. If you’ve connected Claude to the shop and the Statistics section is set to Read-Only or Read & Edit, you can, for example, type “How much have we sold from each supplier over the last 12 months?” Claude uses the same calculation as the website, so here, too, each order counts only once toward the total. Learn more in Statistics and Reports with Claude.
For those with a technical background
Revenue is calculated per item line as the number of times the unit price is multiplied by the unit price minus the line’s VAT portion, summed per supplier. The number of orders in a row is the number of unique orders containing at least one item from that supplier. The total counts the number of unique orders containing at least one item from any supplier—that is, it is not the sum of the rows—and therefore the rows combined may exceed the total. The percentage is calculated based on the rows displayed. The average order value per row is the supplier’s revenue divided by the number of orders in that row, and in the map and total row, it is the supplier’s total revenue divided by the total number of orders. None of these figures are calculated based on the store’s total revenue.
A snapshot of the figures is not saved. If you want to be able to retrieve a period exactly as it appears today, save the CSV file before moving products between suppliers. If you have any questions or notice a figure that doesn’t add up, feel free to email support@shoporama.dk.
Related articles
Suppliers in Shoporama
Guide to suppliers in Shoporama: create and manage suppliers, associate them with products, use the order list, statistics and dropshipping feature.
Cost Prices and Inventory Value
Fill in any missing cost prices to get a more accurate inventory value and profit margin. Guide to the Cost Prices page.
Export sales data from the product overview
Export a CSV file with sales data for your products within a given period.
Unsold Products: Find Your Dead Stock
"Products with No Sales" shows the items in your online store that haven't had a single paid order during the selected time period, how much...
Brands and brands in Shoporama
Guide to brands and brands in Shoporama: create brands, upload logos, link to brand pages, use in filtering, Google Shopping and statistics.
See the number sold of a product
Guide to see how many units you have sold of a specific product in Shoporama.