Customer statistics - understand your customers' behavior
The Customer Statistics page in Shoporama gives you an overview of return rates, customer segments and your most valuable customers.
The Customer Statistics page gives you a comprehensive overview of your customers’ behavior and loyalty. Here, you can see who makes a one-time purchase, who returns, and who your most valuable customers are—all in one place. That insight is worth its weight in gold when you want to prioritize your efforts and get more out of your marketing.
You’ll find the page under Statistics → Customer Statistics in the Shoporama admin.
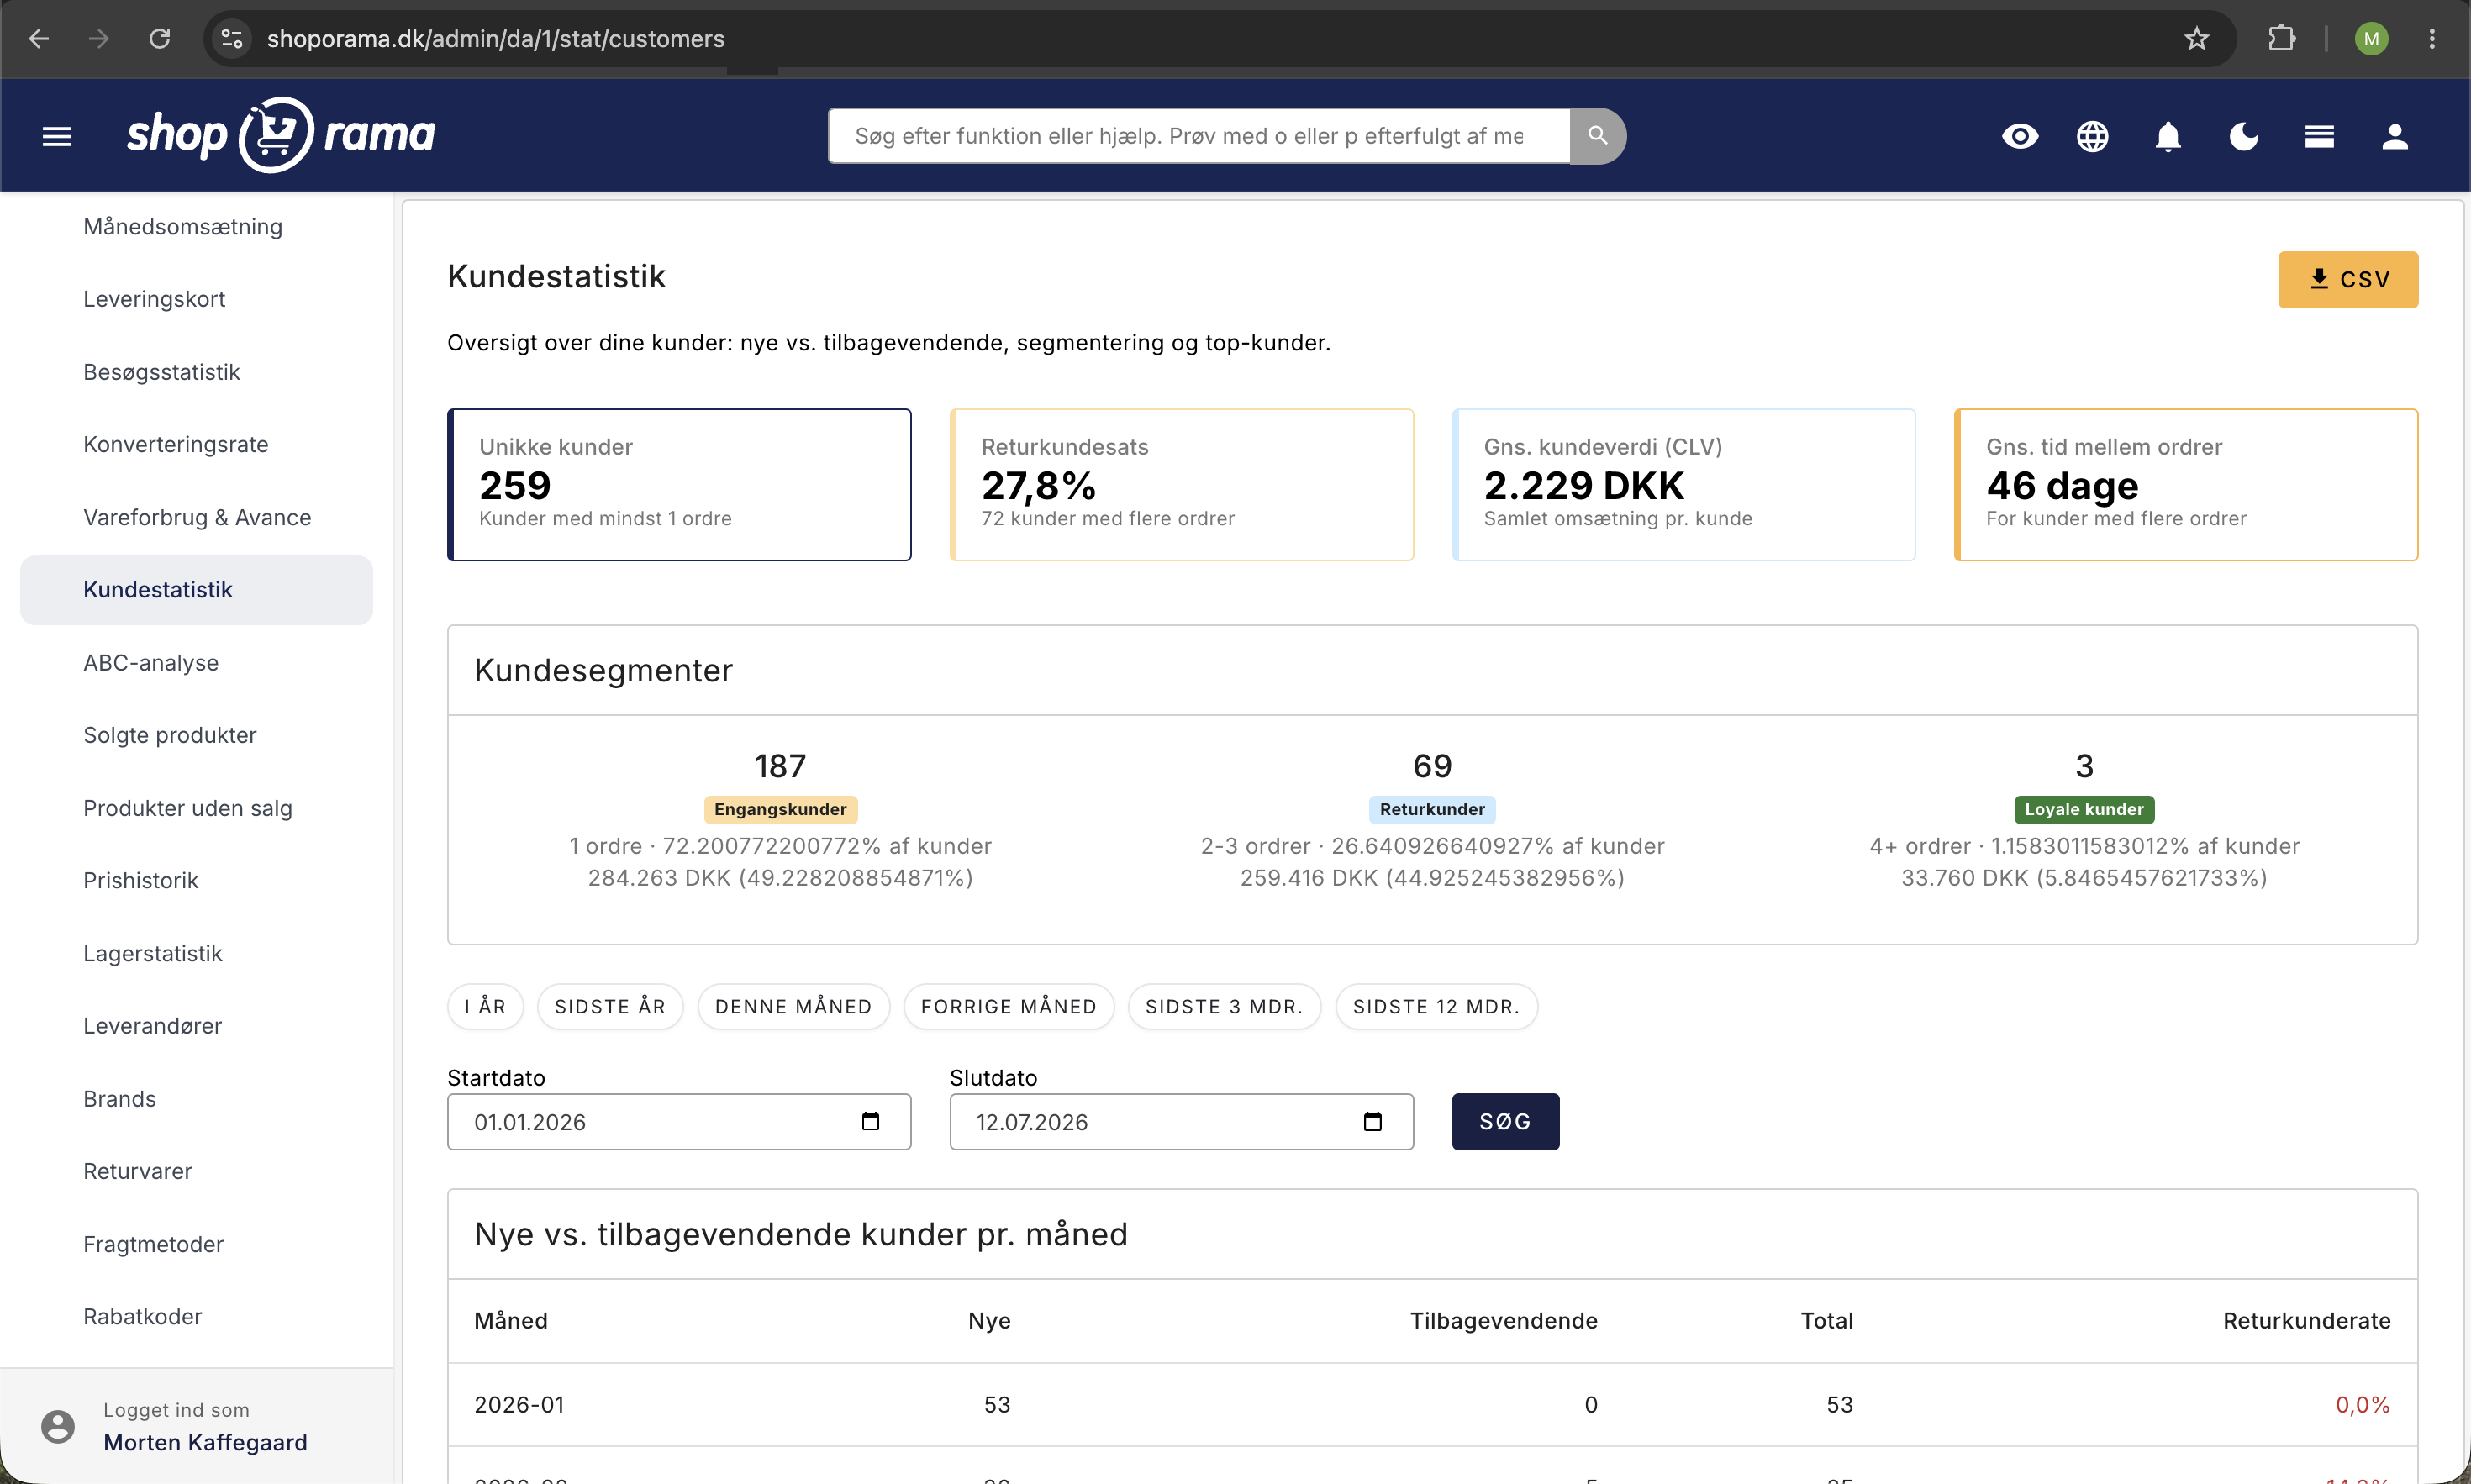
The Overview Dashboard — Four Key Metrics at a Glance
At the top of the page, you’ll find four cards that summarize the most important information about your customers for the selected period.
- Unique Customers — the total number of different customers who placed at least one order during the period.
- Repeat Customer Rate — the percentage of customers who have made more than one purchase. Green indicates 30% or higher (good), yellow indicates 15% or higher (acceptable), and red indicates less than 15% (room for improvement).
- Average Customer Value (CLV) — the amount of revenue generated by an average customer. CLV helps you assess how much it’s worth investing in acquiring and retaining customers.
- Average time between orders — the average time that passes between a customer’s first order and their next one. A low number is a good sign that customers are shopping regularly.
Customer Segments — Understand Your Customer Base
Your customers are automatically divided into three segments based on how many times they’ve shopped with you.
- One-time customers (1 order)—customers who have shopped with you only once. This group is often the largest, and there’s great potential in converting them into repeat customers.
- Returning customers (2–3 orders) — customers who have started coming back. They are prime candidates for targeted retention efforts.
- Loyal customers (4+ orders) — your most loyal customers. They shop regularly and typically account for a disproportionately large share of revenue.
For each segment, the number of customers, their percentage of the total customer base, and the total revenue they’ve generated are displayed.
New vs. Returning Customers by Month
The monthly table shows how the ratio of new to returning customers evolves over time. For each month, you can see:
- New customers — customers making a purchase for the first time.
- Returning customers — customers who have shopped with you before.
- Total — the total number of customers for that month.
- Repeat customer rate — the percentage of repeat customers. Color-coded: green for 30% or higher and red for less than 15%.
The table is useful for spotting trends. A declining rate may be a sign that you should do more to retain customers.
Select a time period
Use the quick buttons to view data for This Year, Last Year, This Month, Last Month, or the last 3 or 12 months—or enter a start and end date yourself in the date fields.
Top 20 Customers
At the bottom of the page, you’ll find a list of your 20 most valuable customers for the selected period. For each customer, the following is displayed:
- Email — clicking on the email address takes you directly to the customer’s orders in the order system.
- Number of orders — how many times the customer has made a purchase.
- Total Purchases — the customer’s total revenue with you.
- Average order value — how much the customer typically spends per order.
- First and most recent order — when the customer made their first and most recent purchase.
This list is useful if you want to give your best customers some special attention—for example, a personalized discount code or a thank-you note.
Export to CSV
You can download the top customer list as a CSV file. This makes it easy to work with the data in a spreadsheet or import it into a newsletter system.
Customer Retention Over Time
Want to see if customer retention is improving over time? Under Statistics → Customer Retention, you’ll find a cohort analysis that groups customers by their first purchase and shows the reorder rate in the following months.
Practical tips for increasing customer loyalty
- Send a follow-up email to one-time customers. Reach out to them with a great offer within 30–60 days of their first purchase.
- Reward your loyal customers. Consider offering a personalized discount, free shipping, or early access to new products.
- Keep an eye on the average time between orders. Use this figure to time your newsletters and campaigns.
- Set a target for the repeat customer rate. Use the color codes as a guide. If you’re in the red zone, it’s a signal to prioritize retention.
- Compare time periods. Use the date filter to compare, for example, this season with the same period last year.
If you have any questions about the customer statistics, feel free to email support@shoporama.dk.
Related articles
Conversion rate - understand and improve your stats
Understand what your conversion rate means and how to use the statistics page in Shoporama to track your progress over time.
Warehouse statistics - overview of your warehouse
Stock statistics give you a complete overview of your stock situation - from tied up capital in dead stock to products that are running low.
ABC analysis: Find out which products make you money
Learn how to use ABC analysis to prioritize your assortment, optimize your inventory and focus on the products that actually drive your business.
Statistics and analytics in Shoporama
Get an overview of Shoporama's built-in statistics tools: dashboard, revenue, profit margin, ABC analysis and much more. Learn how to use data to...
Loyalty programme
Complete guide to the Shoporama loyalty program - setting up the points system, earning, redemption and customer communication.
The newsletter module
Complete guide to Shoporama's built-in newsletter module. Learn how to create campaigns, segment recipients, use A/B testing, set up automatic...
Create a discount code
Complete guide to creating and managing discount codes in Shoporama - percentage discount, fixed amount, free shipping, restrictions and more.
Related features
CAC - Customer Acquisition Cost
CAC is the average cost of acquiring a new customer. Learn how to calculate CAC, understand the CLV:CAC ratio, and reduce your acquisition cost.
CLV (Customer Lifetime Value)
CLV is the total value a customer generates over the entire relationship. Learn how to calculate CLV, why it's important and how to increase it in...
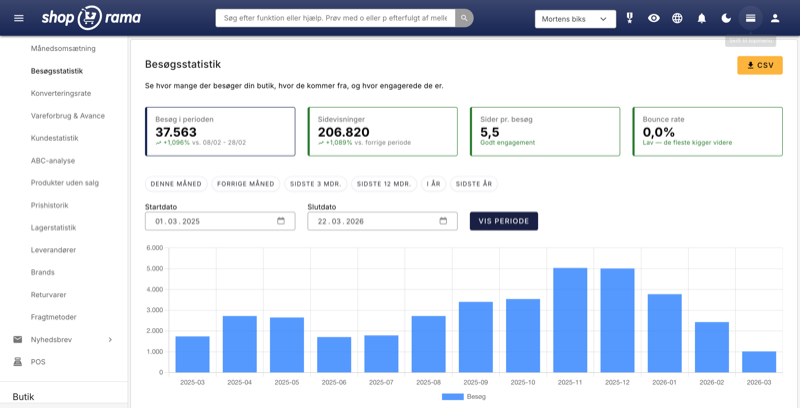
New visitor statistics - understand your eCommerce traffic
See who visits your online store, which days are busiest and where the traffic comes from. Shoporama's new visitor statistics give you the overview.