Customer retention - target repurchase and cohort analysis
Understand your customer retention with Shoporama's cohort analysis. See reorder rates, time to repurchase and a visual heatmap showing how well you retain customers over time.
What do the customer retention statistics show?
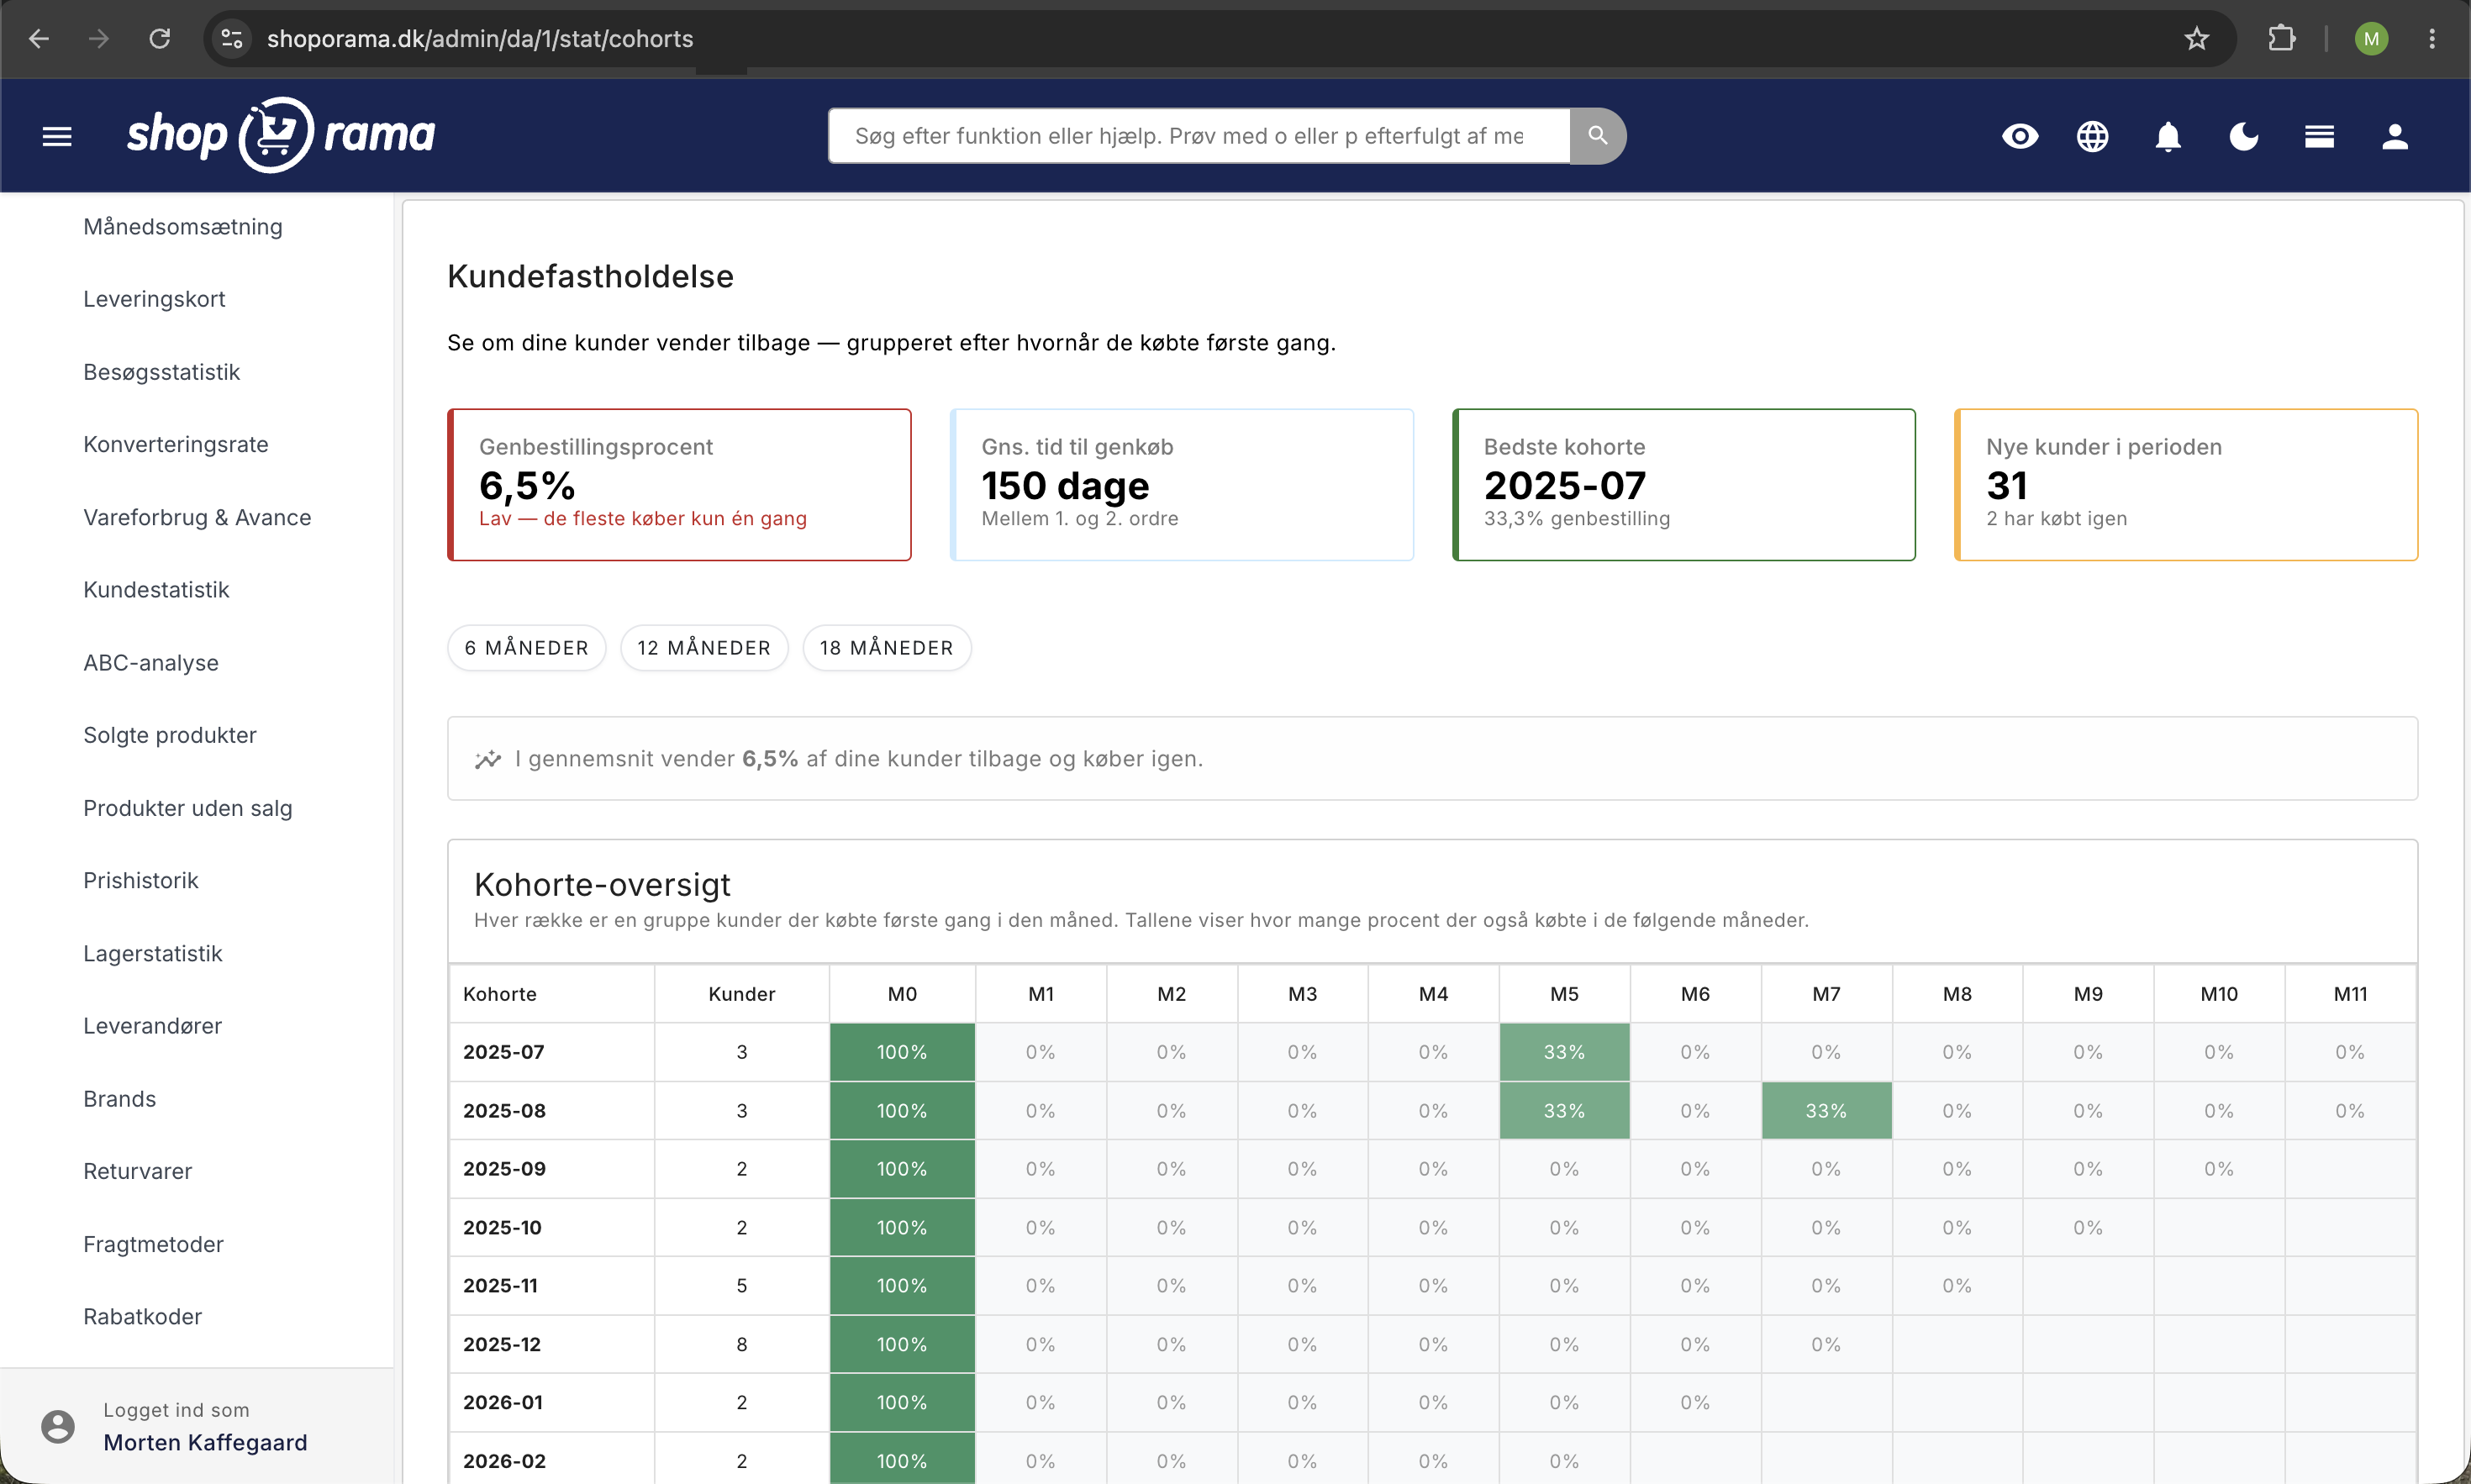
Under Statistics → Customer Retention, you can see how well you’re retaining your customers over time. The page uses cohort analysis to show whether your customers return and make repeat purchases—and when they do so.
It’s far cheaper to retain an existing customer than to acquire a new one. That’s why customer retention is one of the most important metrics for an online store with ambitions for long-term growth.
The four key metrics at the top
- Repurchase Rate — the percentage of customers who have made more than one purchase. A repurchase rate of 20–30% is typical for many online stores, but it varies greatly by industry.
- Average time to repeat purchase — how long it typically takes from a customer’s first purchase until they return. This insight is invaluable for timing follow-up emails.
- Best cohort — the monthly group of new customers with the highest retention rate. This can reveal which campaigns or seasons attract the most loyal customers.
- New customers — the number of first-time customers during the selected period, so you can see if you’re attracting new customers at a healthy rate.
What is a cohort?
A cohort is a group of customers who share a common trait—in this case, the month they made their first purchase in your online store. For example, the “January 2026” cohort consists of all customers who placed their very first order in January 2026. By grouping customers this way, you can compare how different groups behave over time.
How to Read the Heatmap
The heatmap is a grid of color-coded cells:
- The rows represent cohorts—groups of customers based on when they made their first purchase (e.g., “Jan 2026,” “Feb 2026”)
- The columns represent months after the first purchase—M0 is the month they made their first purchase, M1 is the following month, M2 is two months later, and so on.
- The cell value shows the percentage of the cohort that made another purchase in that month
- The colors range from light (low retention) to dark (high retention)
The M0 column always shows 100% because, by definition, all customers made a purchase in their first month. Look at M1, M2, M3, etc., to see how many return. A typical online store sees a sharp drop from M0 to M1, followed by a more gradual leveling off.
Example
Imagine that the January cohort has 200 new customers. If M1 shows 12%, that means 24 of the 200 customers made a purchase again in February. If M2 shows 8%, 16 of the original 200 customers made a purchase in March. By comparing cohorts, you can see whether newer customers are more or less loyal than older ones.
Tips for Improving Customer Retention
- Use the average time to repurchase to time your follow-up —if customers typically return after 45 days, send a follow-up email via the newsletter module around day 40 with relevant product suggestions or an offer.
- Compare cohorts —if one cohort performs significantly better than others, investigate what was different that month. Was there a specific campaign, a new product, or a seasonal effect?
- Activate a loyalty program —a points system gives customers an incentive to return. It can have a noticeable effect on your repeat purchase rate.
- Segment your customers —use customer statistics to understand who your best customers are and tailor your communication accordingly.
- Focus on the customer experience —fast delivery, good customer service, and an easy returns process are crucial to whether customers return. It’s not just about price and products.
Customer retention is a long-term investment. Use cohort analysis to continuously evaluate whether your initiatives are working, and adjust your strategy based on data—not gut feelings.
Related articles
Customer statistics - understand your customers' behavior
The Customer Statistics page in Shoporama gives you an overview of return rates, customer segments and your most valuable customers.
Statistics and analytics in Shoporama
Get an overview of Shoporama's built-in statistics tools: dashboard, revenue, profit margin, ABC analysis and much more. Learn how to use data to...
Loyalty programme
Complete guide to the Shoporama loyalty program - setting up the points system, earning, redemption and customer communication.
Customer groups and segmentation
How to create customer groups and segments in Shoporama for targeted marketing and newsletters.
Send product recommendation emails manually
Shoporama does not have a dedicated 'Send product recommendation email' button. Learn what's actually in the platform and how to send targeted...
Related features
CAC - Customer Acquisition Cost
CAC is the average cost of acquiring a new customer. Learn how to calculate CAC, understand the CLV:CAC ratio, and reduce your acquisition cost.
Churn rate
Churn rate measures how many customers you lose over time. Learn how to calculate churn, understand the causes, and reduce churn in your online store.
CLV (Customer Lifetime Value)
CLV is the total value a customer generates over the entire relationship. Learn how to calculate CLV, why it's important and how to increase it in...
Statistics and analytics
Dashboard, revenue, profit margin, ABC analysis and more. Shoporama's built-in statistics tools give you insights to run your online store profitably.
Loyalty program - reward your customers with points
Increase repurchases with Shoporama's points system. Customers earn points on purchases and use them as discounts. Signup bonus, expiration and...